CMMS maintenance software analysis and reporting features provide added benefits to the maintenance manager besides the expected management and scheduling of work and preventive maintenance. This software relies heavily on its many easy to use analysis tools. Specifically, performing CMMS data analysis using drag and drop or by simple point and click is intuitive and fast. This is accomplished by the powerful report builder included in the software. All fields in all screens are available to the CMMS report builder analysis screen. Furthermore the report builder provides charts, subtotals on all value fields and has a very simple intuitive interface to work from.
Consequently no other CMMS software anywhere comes close to MaintSmart's analysis and reporting capability! Not convinced? Contact us for a personalized online demo and your own test drive of this amazing system.
Analysis Benefits of CMMS Maintenance Software
The analysis capabilities of this software are numerous. Here are a few examples:
- Down time (equipment failure tracking) analysis guides the maintenance manager towards data-driven solutions saving lost time, lost product along with labor and spares savings.
- Work order analysis and preventative maintenance is used to summarize with statistical methods how resources are being allocated. Understanding this is critically important to the maintenance manager for scheduling and personnel assignments.
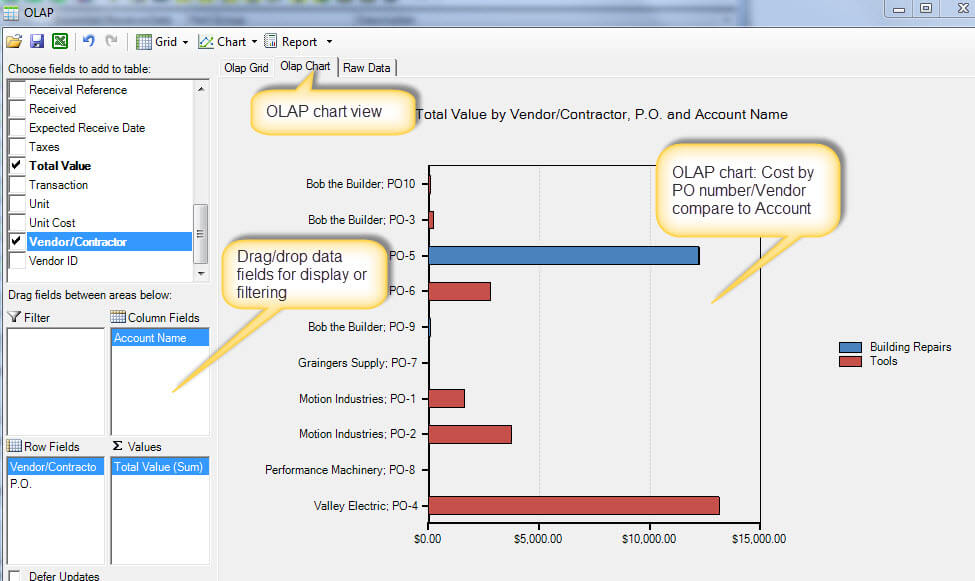
- Purchasing analysis offered detailed reports on purchases. These reports included open vs. closed purchase orders, back-orders, account budget status, cost center expenditures and much more. Inventory analysis reporting informs the maintenance manager about parts used, where used, by whom and for what purpose. Additionally inventory audit and over/under stock analysis comes in several variations.
MaintSmart CMMS has EAM software capabilities for life cycle, analysis and other EAM specific capabilities.
CMMS Software Reporting Methods
CMMS software reporting is flexible. Additionally, every screen and every record of data in the entire CMMS maintenance software system provides reporting, statistically summarizing and charting by simple drag and drop. Furthermore there are four different ways to analyze downtime equipment down time.
- Top Worst/Top Best
- Grouped Category Analysis
- Crosstab Analysis
- Cost of Downtime.
Each of these analysis options consists of simple point and click selection.
All analysis screen provide an OLE Automation interface to Excel. No other CMMS software anywhere has this powerful feature. Multiple file formats are available for your CMMS analysis reports:
- Adobe Acrobat.
- Microsoft Excel.
- Microsoft Word.
- Rich Text.
- XML
- Text format.
- Crystal Reports.
- Web page (.html).
- All popular image formats.
In addition to these analysis and reporting methods there are also many filterable 'canned' reports for many useful purposes.
Advanced Analysis Tools
There are several advanced analysis tools available. The reliability analysis screen uses AMSAA reliability analysis (military standard) algorithm to obtain Failure Rate and Mean Time Between Failure (MTBF). Another analysis tool not found in any other CMMS maintenance software is OEE (overall equipment effectiveness). OEE is particularly useful in a manufacturing environment. OEE give a well-rounded picture of the overall performance of the production process utilizing the following parameters:
Availability: The percentage of actual run time vs. scheduled run time.
Performance: is the percentage at which the equipment actually produces vs its design run speed.
Quality: measures the percentage of good product vs. all product.
OEE = Availability X Performance X Quality
MaintSmart also tracks down time using a total of three (3) time values. As expected Time Down and Time to Repair are a part of this. The third time value is Impact. Impact is used as an opportunity cost or a way of quantifying non-maintenance costs to your company. The cost of lost product, remakes and production overtime should be very important to track. Oddly this is the only CMMS maintenance software that tracks this important value.
Preventative Maintenance Completion Rate.
Learn How to Use the Query-Builder CMMS Analysis Tool.
Case Study in Machine Downtime
A commercial baking operation in California has experienced uncharacteristic losses on their bread lines over the past year. The bread production department assumes it is the bread wrapping departments problem. Furthermore, both departments say that the maintenance department is the source of their equipment problems. There has been more equipment stoppages recently however up until three months ago, prior to purchasing a good CMMS maintenance software, the logging of down time was on paper making it difficult to analyze for the root cause(s). In short, this baking operation is now in a position to look at this downtime data in an objective way. So how should this problem be approached?
Organize the Downtime Data
A team is established to explore and hopefully solve this issue. The following data is immediately available for the past 3 months:
- On 1/1/15 a breakdown on the bread proofer caused by a jammed rack resulted in 30 minutes of lost time. Bread Proofer: a large box or room where bread is placed to rise. This is accomplished with exact humidity settings.
- Bread production labor losses in the wrapping department between 1/3/15 and 4/3/15 resulted in a total of 240 minutes of overtime (tracked as 'Impact' in CMMS).
- There have been a total of 30 additional minutes lost due to miscellaneous equipment failures (down time) during this 3 month period.
Analyze the Machine Downtime Impact and Causes
Analysis of this data in the downtime analysis module reveal the following:
- The 30 minutes lost time 1. above also resulted in lost product that required the production department (12 employees) to work overtime 2 hours to replace this lost product. This resulted in a total cost to the bottom line for the company of $600 in labor and $1500 in lost product.
- An overall equipment effectiveness (OEE) analysis is performed in both production and wrapping departments. The overall OEE value is 78%.
- Examining the components of OEE the team finds that the Performance= 96%, Availability=94%, Quality = 87%.
- Exploring the Quality reveals that a disproportionate amount or bread discarded or damaged due to not fitting in the bags.
- Over-sized bread loaves caused this problem. After back-tracking it is discovered that a humidity sensor in the proofer was damaged when the failure occurred on 1/1/15.
- The estimate of losses for this reason (5.) is $3900.
- The sensor in the proofer is repaired. Additionally, a task to test this sensor at every shift change prevents this failure from reoccurring. The CMMS print and email scheduler sends this preventive maintenance task list to the appropriate personnel at the beginning of their shift.
Learn how to use data analysis software tools.
Learn more about basic work order analysis.
Overall Cost of Equipment
The CMMS maintenance software has an overall cost of equipment reporting module. These reports display all downtime components (time down, time to repair, impact), all down time parts, preventive maintenance parts and labor, work order parts and labor. An automatically created pie chart displays the top five worst performing machines. Additionally, improve your maintenance numbers by optimizing this data using the many available filters.
Why is the Overall Cost of Equipment an Important Metric?
Overall cost of equipment takes into account the all costs of owning an equipment item or group of equipment items. Knowing the overall cost to own equipment is an important first step in understanding where to focus maintenance (and others) efforts in reducing overall costs in general. Subsequently, the maintenance manager uses these general cost figures arm himself with real data leading to real solutions.
The cost to own equipment report displays subtotaled equipment maintenance data. These subtotals clearly shows the reason for these costs. (Examples of subtotals are: sum, average, variance, count, standard deviation and many more.) Specifically, the software analyzes these costs separately whether downtime, PM, work order, spares or other reasons. In other words, the software displays a breakdown of why and how various costs occur for each component. For instance, out of range costs could be from an isolated equipment breakdown that really has no preventable cause. In this case this cause should be ignored and focus placed on preventable failure causes. Subsequently, these particular equipment failure cause are prevented resulting in cost reductions for this equipment item.
Digging Deeper Into Excessive Equipment Costs
The software also captures out of range machine costs not directly related to maintenance. For example, in a manufacturing environment production lines are dependent upon equipment up or down stream from the analyzed equipment item. As such, these increased costs reflect upon the target equipment even though these increased costs derive from another equipment item.
To this end, MaintSmart also has the capability of analyzing groups of equipment item together. For example, a "group" could be a production line and all of this line's linked or associated equipment. In short, our CMMS solution offers multiple ways to get answers regarding the causes of increased equipment costs. Eventually, proper corrective action drives costs down after determining the exact reasons for the downtime. The result is as smoother running operation with better bottom line results.


Get started with our CMMS for a free 30-day trial period. This is the full software program with all modules. Take advantage of free personalized online training during the demo period too. Don't wait. Take action now!
Contact Us! We want to hear from you.
- Free help documents and videos?
- Free personalized online demonstration?
- Any questions?
- Pricing for software?
- Formal quote or proposal?
- Free consultation?
- All suggestions and comments are welcome!
MaintSmart Software, Inc., 66164 Homestead Rd., North Bend, OR, 97459 U.S.A.
+1-541-404-0616 ~ [email protected]