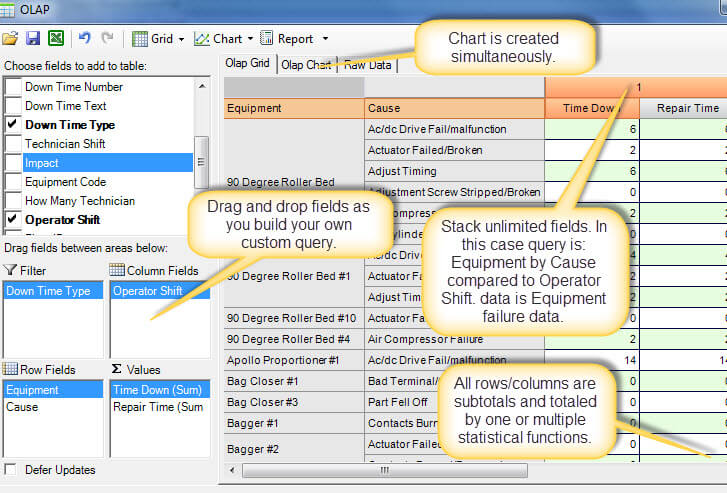
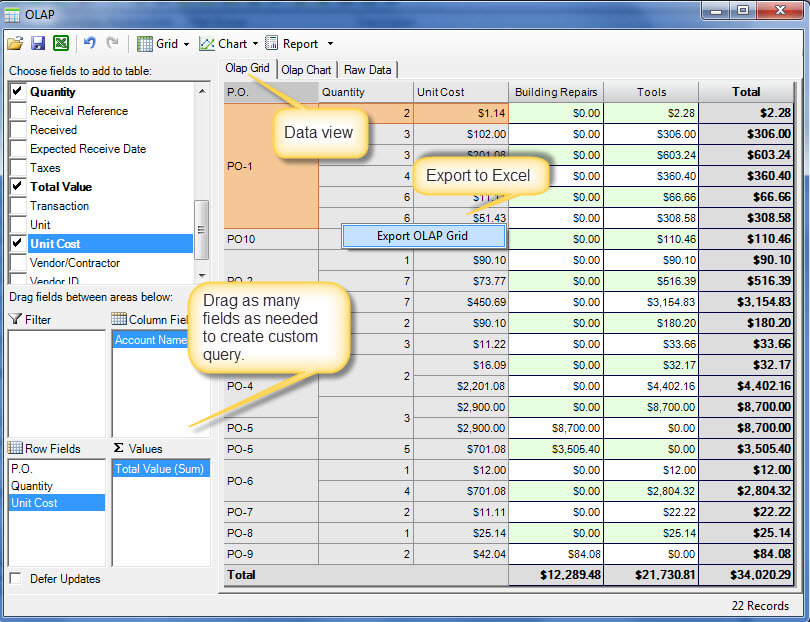
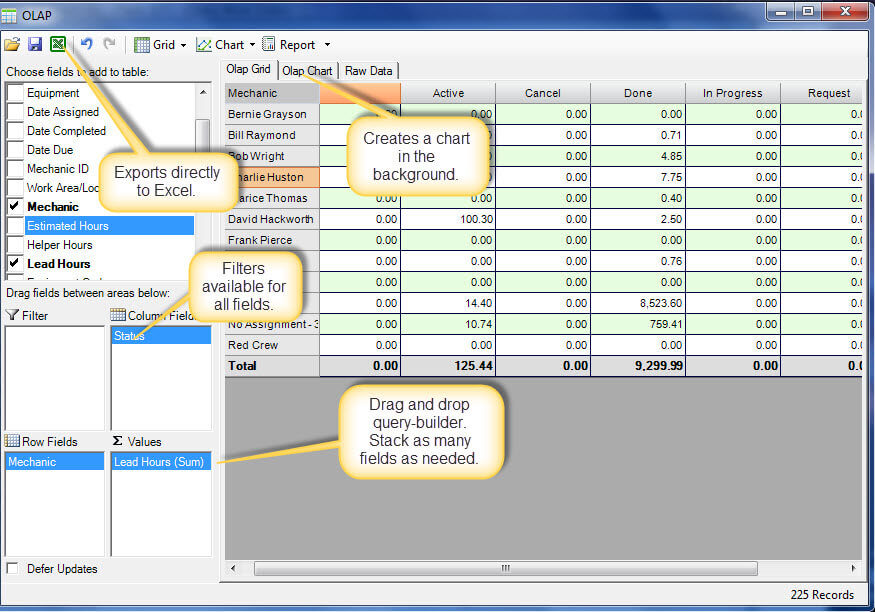
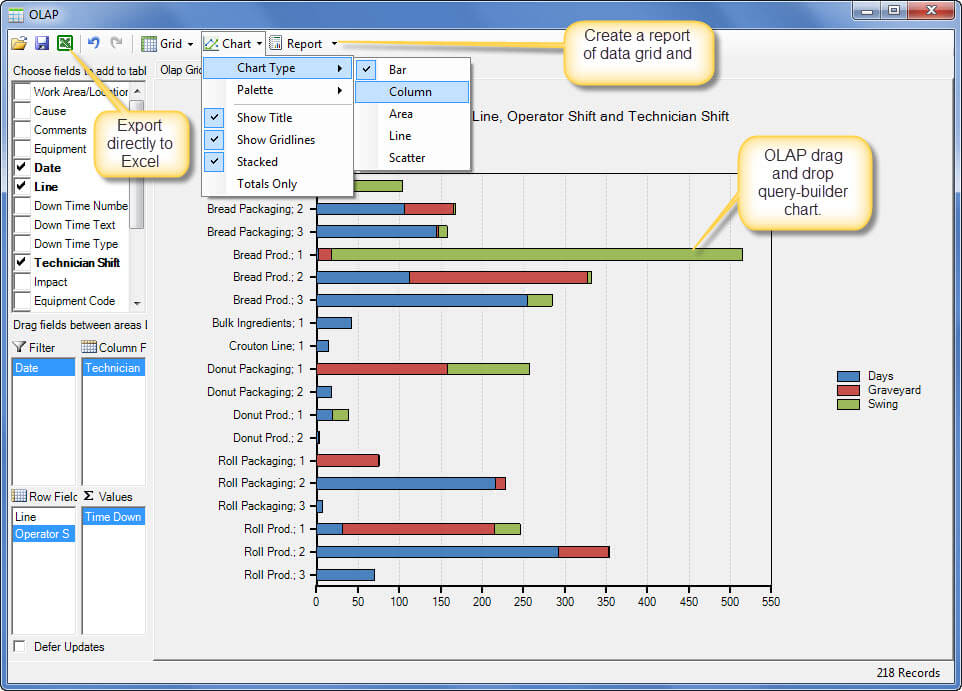
This CMMS charting solution is the only computerized maintenance management system that includes an custom report builder tool. Report Designer provides powerful analysis for your CMMS solution data by simple drag and drop. Additionally the Report Designer is building a chart in the background automatically as you drop data fields into the Report Designer component. This is ridiculously simple to use.
This report builder enables the user to build queries and subsequent reports on every screen in the program. The report builder is full featured providing color flags for out of range data, multiple stacked fields in each analysis scenario and all of the common statistical functions you would expect in a CMMS charting solution. If that's still not enough analysis power then simply convert the entire data set into an Excel spreadsheet with two (2) button clicks.
Our Report Designer uses OLAP (online analytical process) or more commonly called data cubes as well as two-dimensional data sets to create exactly the report you needed in seconds. The report creation process is very simple and intuitive.
CMMS Charting Solution for Data Analysis
A common comment we get is: "...our company has a CMMS that we have entered data into, however much of the data we cannot get out for reporting purposes when we need it..." MaintSmart addresses this with the CMMS report designer component. Use maintenance data from any screen to create a chart or graph. Equipment maintenance data is always available for reporting and analysis. All of the data in this computerized maintenance management system software is available for exporting to Excel.
Charting and analysis is available in all screens in the entire CMMS software program. Additionally each report builder scenario that is created by drag and drop (this takes seconds) may also be saved as an ".olapx" file and reused. High and low range values may be flagged by color making it easy to identify them in the resulting data grid. While the data is being dropped a chart is built automatically reflecting this new data set. Multiple chart formats are available.
No other CMMS charting solution provides this useful capability at any price!
Custom Reports Options and Tools
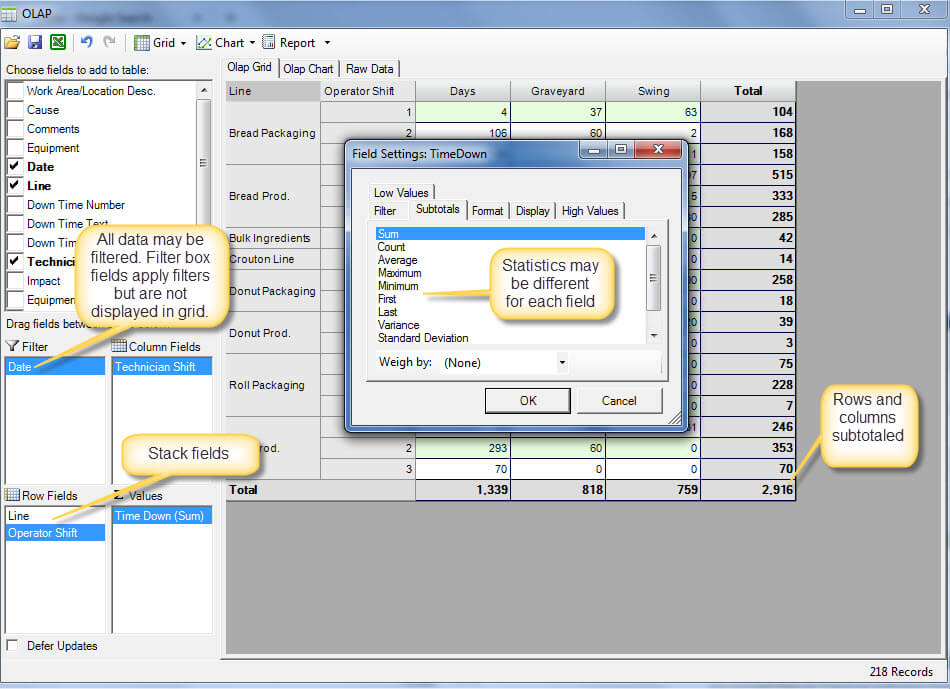
The report builder provides simple drag and drop queries resulting in detailed charts. Although these are simple to create they do generate very sophisticated data sets if needed. The data is grouped and subtotaled across rows and columns. Each row or column may have multiple data field stacked on each other. Statistical functions are available for each row or column as follows:
- Sum
- Average
- Count
- Standard Deviation
- Variance
- Minimum
- Maximum
- First
- Last
- Population Variance
- Population Standard Deviation
Choose the subtotal statistical function needed for each of the stacked rows and columns. This component is completely flexible to whatever you need in data reporting and analysis.
Charting and Reporting Using the Report Designer
The Report Designer also has built-in filtering. All dropped data fields may be filters with several built-in filter options and a custom option as follows:
- >, >=, <, <=, *
- equals, not equal
- begins with
- ends with
- contains
- between
There are several data formatting options that enable the maintenance manager to create the exact report needed in the proper format. High and low values may be colored to stand out. Clicking on a value (sum for example) drills down and displays the source data in a pop-up screen.
Export formats include Excel and Adobe Acrobat with or without a chart. Multiple chart types are also available. Use this report builder to generate simple or very comprehensive reports from the MaintSmart computerized maintenance management system.
CMMS Charting Solution with OLAP Report Builder
Down Time Analysis Example with Report Builder
Inventory Management Accountability Made Simple
The Report Designer is particularly well-suited for analysis of equipment down time, work orders, preventive maintenance and inventory usage data. For the purposes of spares usage the report builder is very useful in how it groups parts used by technician, equipment, part or other available field.
CMMS Report Designer for Equipment Failure Analysis
Equipment failure analysis (down time) provide a great place to use the report builder tool. Quickly isolate the down time issue with either the report builder or use one or more of the other down time analysis tools first then dig deeper into the analysis by linking the results to the Report Designer component. Export this data set directly to Excel for additional analysis. Experience rapid improvement in your equipment maintenance with these powerful analysis tools.
MaintSmart Software, Inc., 66164 Homestead Rd., North Bend, OR, 97459 U.S.A.
+1-541-404-0616 ~ [email protected]

