CMMS Determines Maintenance Cost / Replacement Asset Value
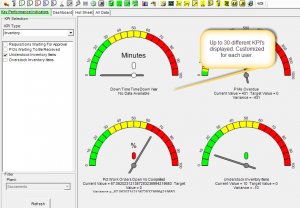
Our CMMS software now offers maintenance cost/replacement asset value as a KPI. Additionally, multiple downtime related KPIs provide a clear path for the maintenance manager that is looking to improve machine reliability. Predictably reducing machine downtime typically offers the greatest potential in immediate improvement. As such, MaintSmart offers many downtime KPIs for evaluating machine downtime and improving availability. Here are a few:
- Overall Equipment Effectiveness (OEE)
- Mean Time Between Failure (MTBF)
- Instantaneous Failure Rate
- Mean Time To Repair (MTTR)
- Availability
The above list of KPIs are useful for identifying opportunities in a manufacturing plant maintenance program. However, none of the above KPIs answer the question of: “When is it appropriate to replace your equipment and at what point does purchasing new equipment provide a cost benefit over continued maintenance expenses?”
When Does the Cost of Maintenance Exceed the Value of Factory Machinery?
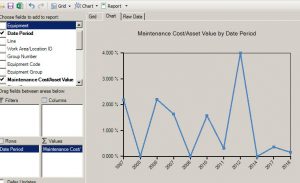
MaintSmart recently added Maintenance Cost / Replacement Asset Value to its suite of KPIs. This article will focus on Maintenance Cost / Replacement Asset Value (MC/RAV) and how it will benefit your organization. This metric refers to maintenance costs as a percentage (%) of the asset value. Maintenance costs included are preventive maintenance, project work orders, repair work orders, all losses attribute to machine downtime and all spares used on the machines. The MaintSmart CMMS software program captures all of these costs with routine use. Any other appropriate costs, such as normal operating costs, are manually added if needed. Typically, this metric compares maintenance costs to asset value for multiple (or a single) manufacturing plants on a year-to-year basis. Of course, the returned KPI is only as accurate as the data used to make these numerous calculations. It is also important to note that consistency in year-to-year data entry and analysis is required for an accurate comparison.
In the case of Maintenance Cost / Replacement Asset Value a lower value the better. The primary goal of this KPI is to determine if year-to-year maintenance costs are properly controlled. A 2% MC/RAV places your factory near the top for maintenance practices. At this level, the factory would run for fifty years before your expenses for maintenance justify a completely new factory. At the other end of the spectrum a MC/RAV approaching 20% means that you could actually purchase a completely new factory every five years with the money spent on maintenance. The video below uses data from our sample manufacturing plant database.
Learn How to Determine and Report Maintenance Cost to Replacement Asset Value
Note: The values reflected in this data are unrealistically favorable, however, the purpose of the video is to instruct on how to obtain this KPI from your CMMS data. Additionally the sub-total value at the bottom of the MC/RAV column makes more sense if Average is used instead of Sum. There are multiple ways to sub-total the OLAP report builder and Average is one option.


